

Bobby's Crossing just north of Zuni Bowl grade control structure, 2005

Annual Photography Point #10, looking south, 2006

Point #10, looking north, 2005

Bobby's Crossing same location, 2020

Same Point #10, 2014

Same Point #10, 2020
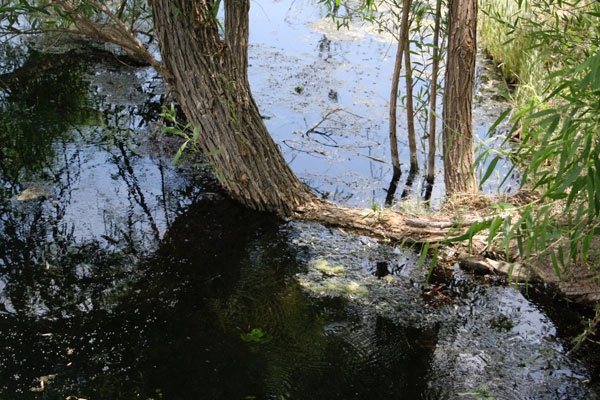
Willow Pond, 2007
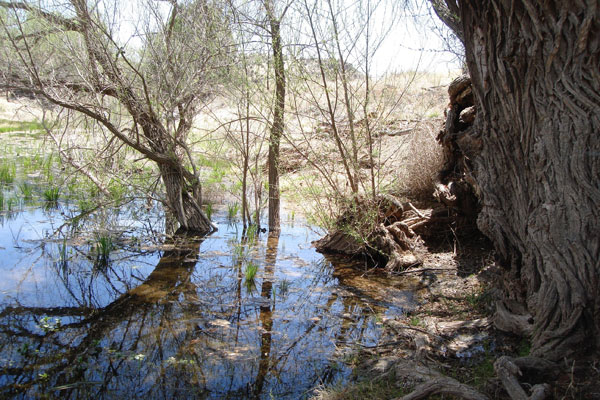
Willow Pond, 2008

Annual Photography, below Willow Pond, 2005

Same location, below Willow Pond after Hinge-Felling regrowth, 2017

We decided to Hinge-Fell the Gooding’s willow trees we planted in the 2005 photograph above and this picture illustrates pulling the tree down after the cut and five notches. All the trees were laid horizontal. October 24, 2013.

This is the same location as the photograph on the left. I Hinge-Felled and leveled all the trees into a grade-control structure in October of 2013 and five years later the felled trees captured this sediment and the trees have re-grown. October 22, 2018.
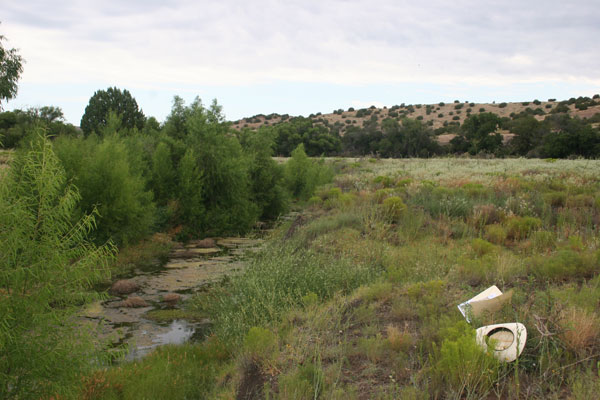
Annual Photography Point #3, looking North, 2005

Same location, five years later, 2010
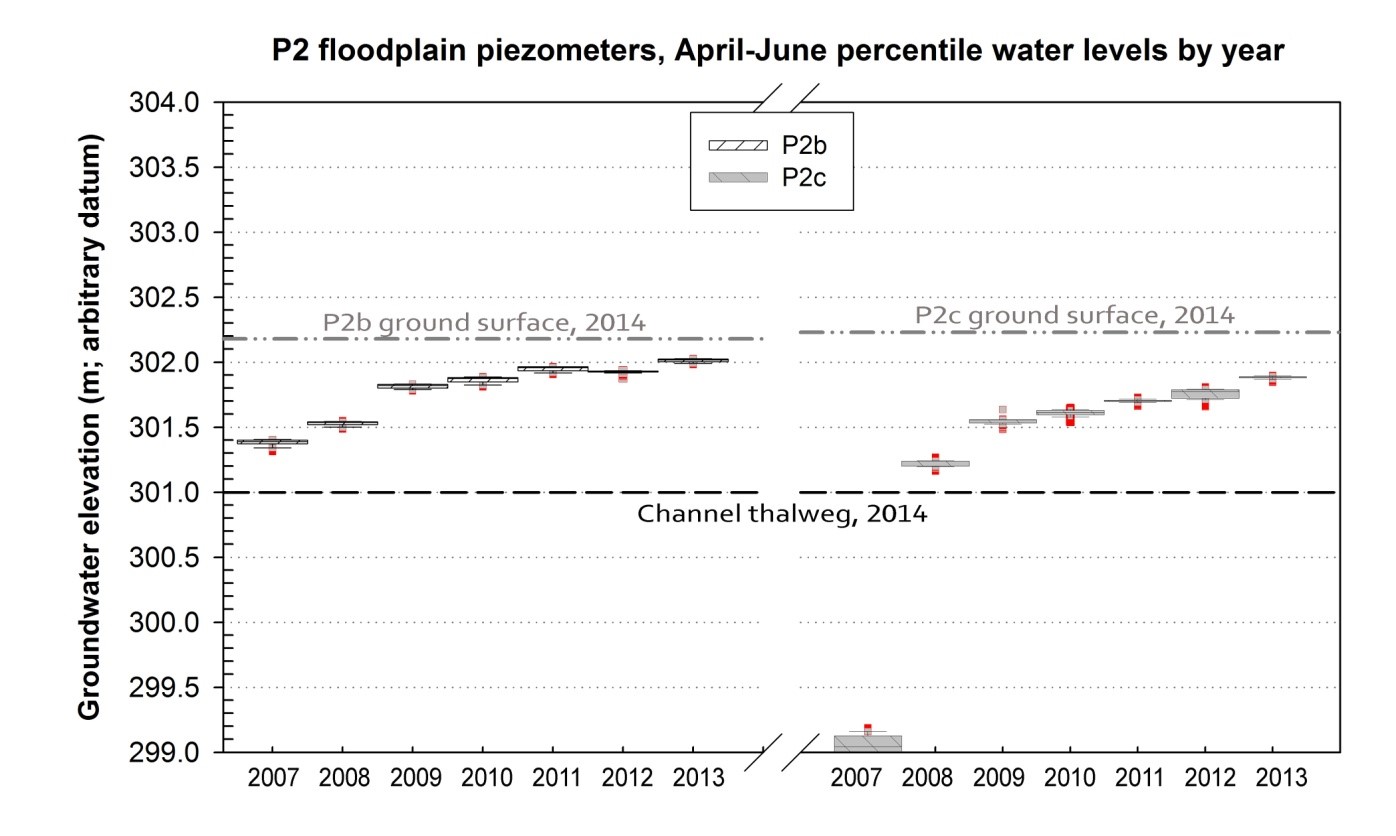
The above chart shows the annual percentile groundwater levels (box plots) from two floodplain wells (P2b and P2c) on transect P2, 2007-2013, from hourly transducers data. Water levels depicted by each box are shown relative to the elevation of the Burro Cienaga channel bottom (thalweg) and the ground surface level at each well. Water levels are in meters (m), relative to an arbitrary elevation control datum established for the surveys. These data were collected during the typical dry period each year, April–June. Average groundwater levels in both wells increased almost every year, despite large differences in watershed precipitation during these months among years. For instance, in 2011, zero precipitation was recorded in the watershed. Repeat mapping of the channel and floodplains around transect P2 in 2007 and 2014 documented aggradation of nearly 50 cm, corresponding with rising groundwater levels.

Ellen Soles removes transducers from well to collect data.

Bill Zeedyk modified satellite map
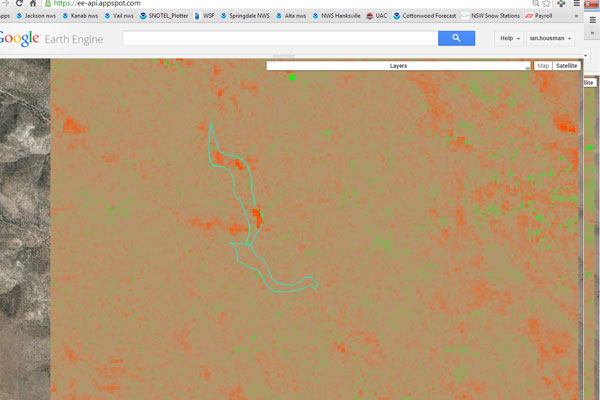
2003 Satellite image illustrating dryness (red)
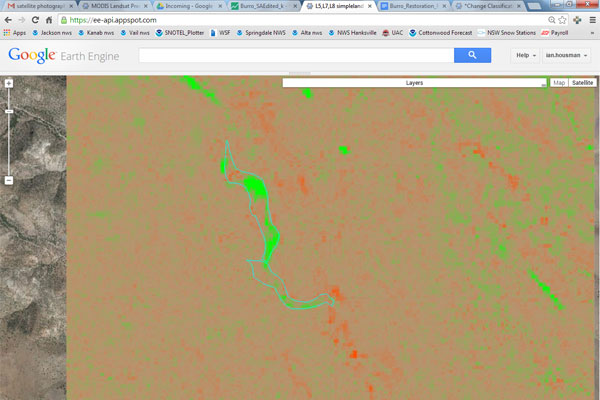
2014 Satellite image illustrating moisture (green)